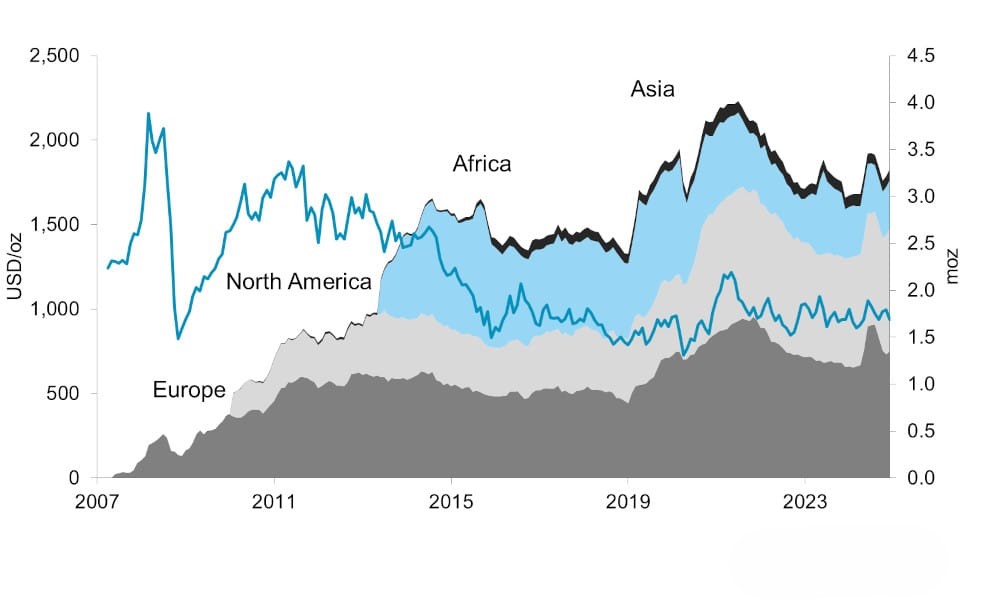
ETF Holdings By Region
Source: Metals Focus Prepared For World Pt Investment Council
The chart provides a comprehensive overview of gold ETF holdings across major regions—Asia, Africa, North America, and Europe—from 2007 to 2023. It illustrates the trends in gold investments, measured in thousands of ounces and USD per ounce, highlighting the fluctuations and regional contributions to the global gold ETF market over time. The data reveals how each region's holdings have evolved, reflecting changes in investment patterns and market dynamics across the years