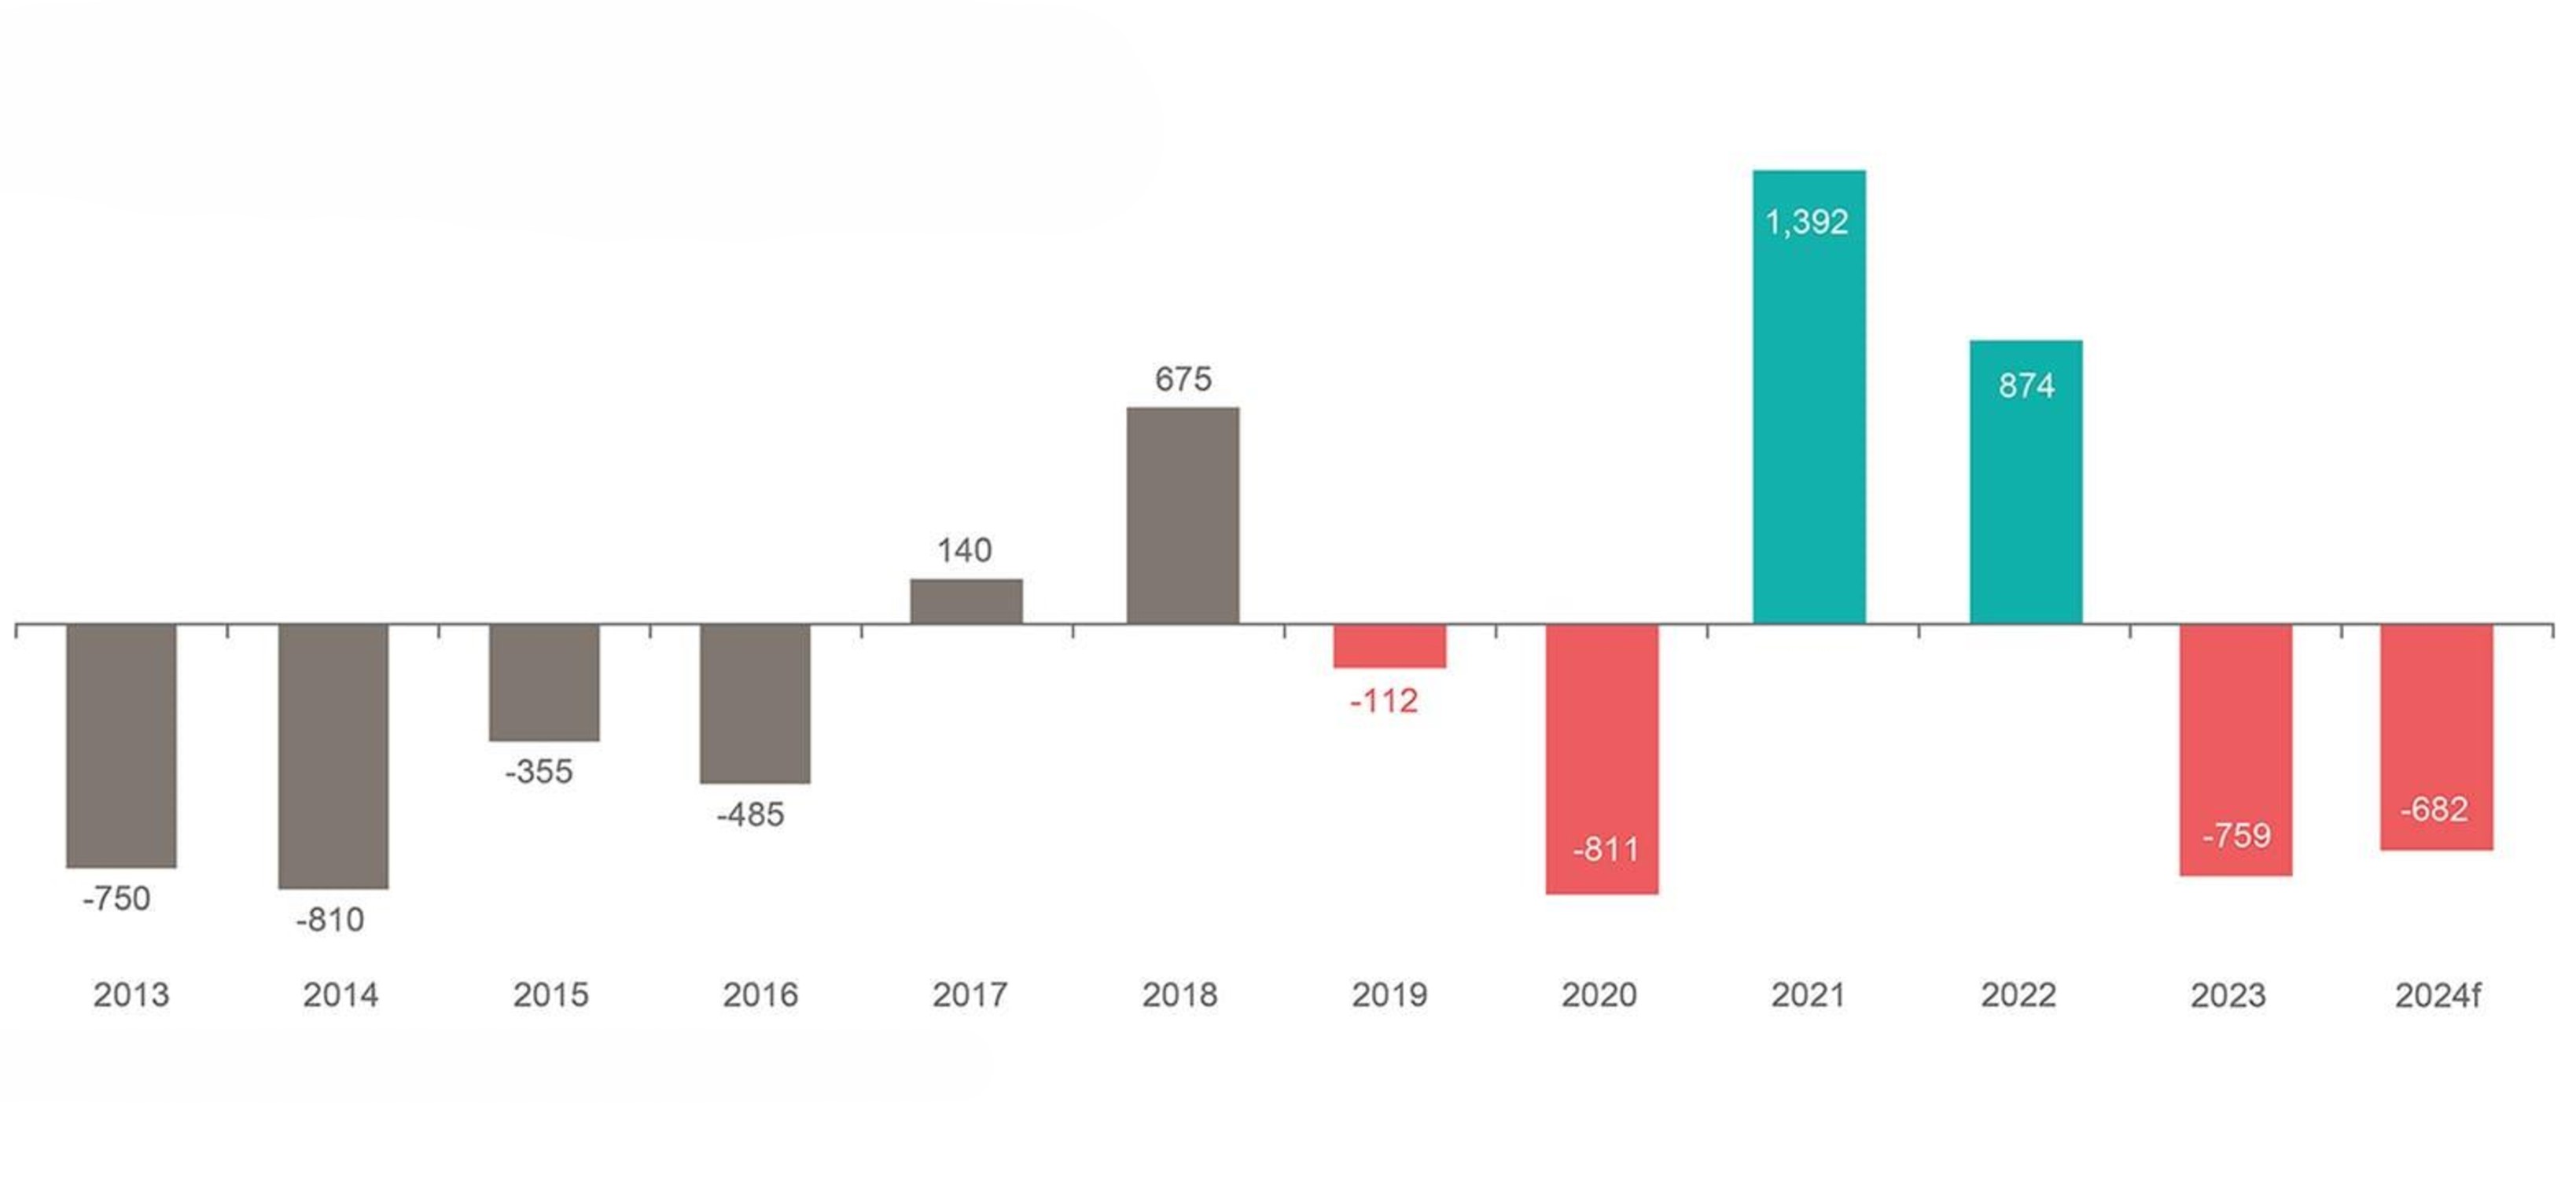
Supply Demand Balance, koz, 2013-2024f
Source: SFA (Oxford) 2013 - 2018, Metals Focus 2019 - 2024f
The chart illustrates the annual supply-demand balance of platinum from 2013 to the forecasted year 2024, measured in thousands of ounces (koz). It captures the fluctuations between supply and demand over this period, highlighting years of surplus and deficit. For instance, in 2013, the balance was 675 koz, indicating a surplus, while in 2014, it dropped to -750 koz, suggesting a deficit. This data is essential for understanding the market dynamics, including production levels, consumption trends, and the impact of economic factors on platinum availability. By analyzing these trends, industry stakeholders can better anticipate market conditions, plan production, and make informed investment decisions to navigate the complexities of the platinum market.