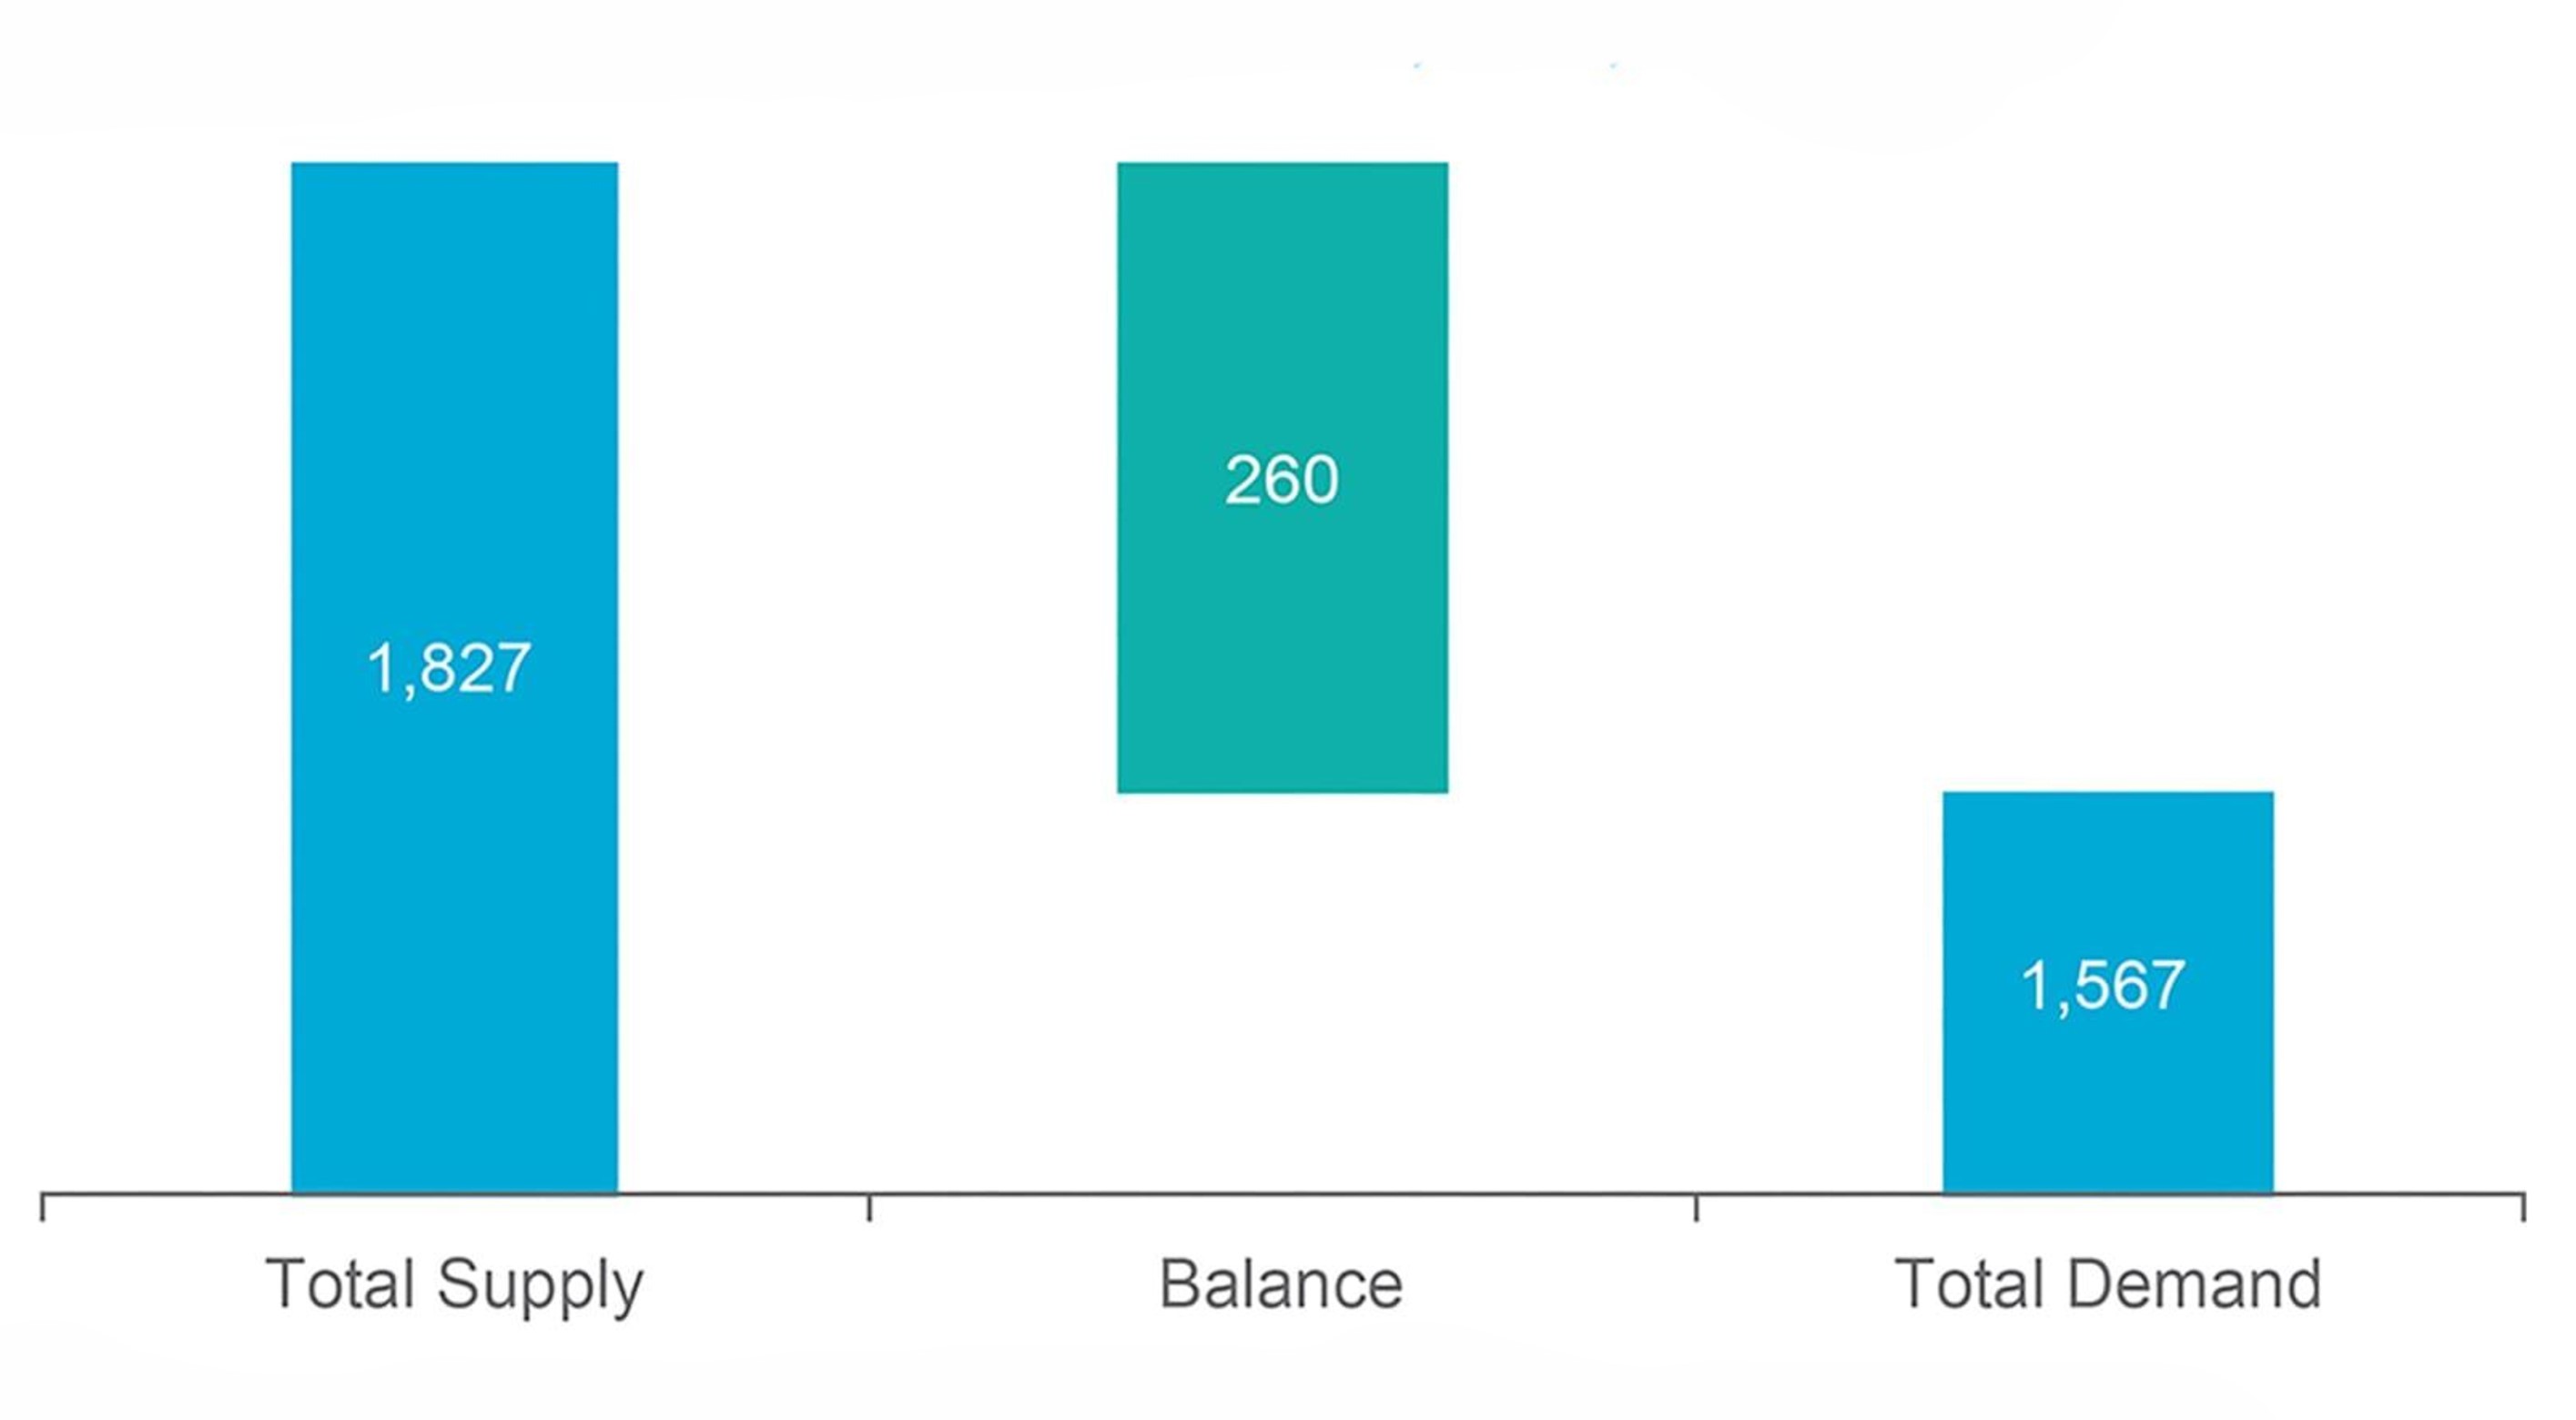
Supply Demand Balance Balance, koz, Q3 2024
Source: Metals Focus Prepared For World Pt Investment Council
The chart offers a concise overview of the platinum market's supply and demand dynamics for the third quarter of 2024, measured in thousands of ounces (koz). It highlights key metrics such as Total Supply, Total Demand, and the resulting Balance, with specific figures like 260 koz and 1,827 koz likely representing the balance and total demand, respectively. This data is crucial for understanding production levels, consumption across various sectors, and the overall market equilibrium. A positive balance indicates a surplus, while a negative balance suggests a deficit, providing valuable insights for industry stakeholders, including producers, investors, and policymakers. By analyzing these metrics, stakeholders can better anticipate price movements, plan production, and make informed decisions to ensure market stability and optimize investment strategies.